Everyone thinks a Google Search Console SEO audit requires expensive tools and complex spreadsheets. That conventional wisdom has been costing businesses rankings for years. The reality? Google’s free platform gives you 90% of what those $300/month tools provide – if you know where to look.
Picture this: You’re sitting on a goldmine of SEO data, refreshed every 16 hours, completely free, straight from Google itself. Yet most site owners check Search Console maybe once a quarter, click around randomly for five minutes, then go back to guessing what Google wants. Crazy, right?
Here’s the thing – running a proper Google Search Console audit isn’t about having fancy software. It’s about knowing which reports truly matter and which metrics drive results. This guide walks you through the exact process to uncover (and fix) the issues holding your site back.
Essential Reports for SEO Analysis
Think of Search Console as your site’s medical chart. Each report shows different vital signs, and together they paint the full picture of your SEO health. But not all reports deserve equal attention. Honestly, you could ignore half the dashboard and still catch 95% of your problems.
Performance Report
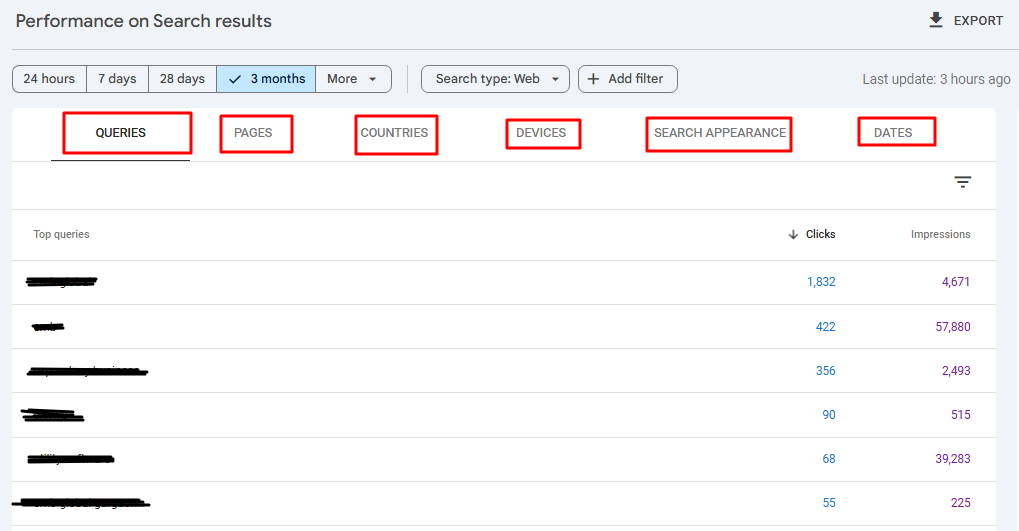
This is where the magic happens. The Performance report shows you exactly which queries bring traffic, your average positions, and – here’s the kicker – your click-through rates for each keyword. Most people glance at total clicks and move on. Big mistake.
The real gold? Filter by queries ranking in positions 11-20. These are your low-hanging fruit. A small push gets them to page one. Also check queries with high impressions but low CTR (under 2%). Your title tags probably need work. Also, you can check website traffic by country and other feature too.
Additionally, this report lets you analyze website traffic by country, device type, and page, giving you a complete view of where your audience comes from and how they interact with your site.
Page Indexing Report
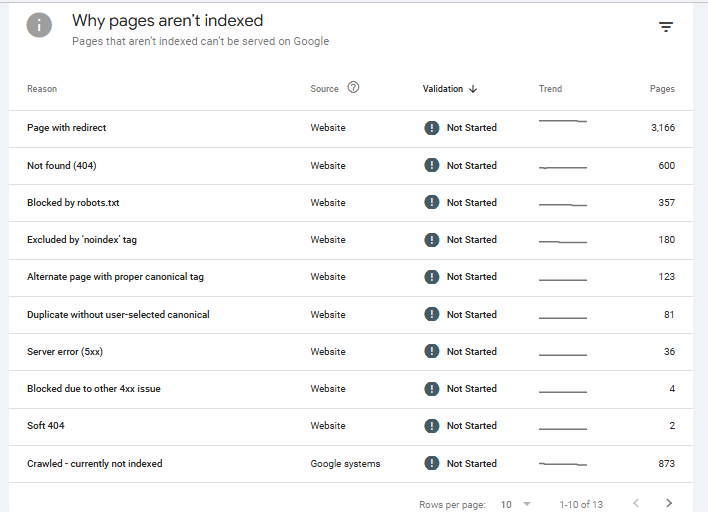
Remember when you published that brilliant blog post three months ago, and it still gets zero traffic? The Page Indexing report explains why. It shows every URL Google has crawled and whether it made it into the index.
Look for these red flags:
-
Discovered – currently not indexed: Google found your page but decided it wasn’t worth indexing (ouch)
-
Crawled – currently not indexed: Even worse – Google looked at your content and said “no thanks”
-
Duplicate without user-selected canonical: You’ve got content cannibalization issues
Core Web Vitals Report
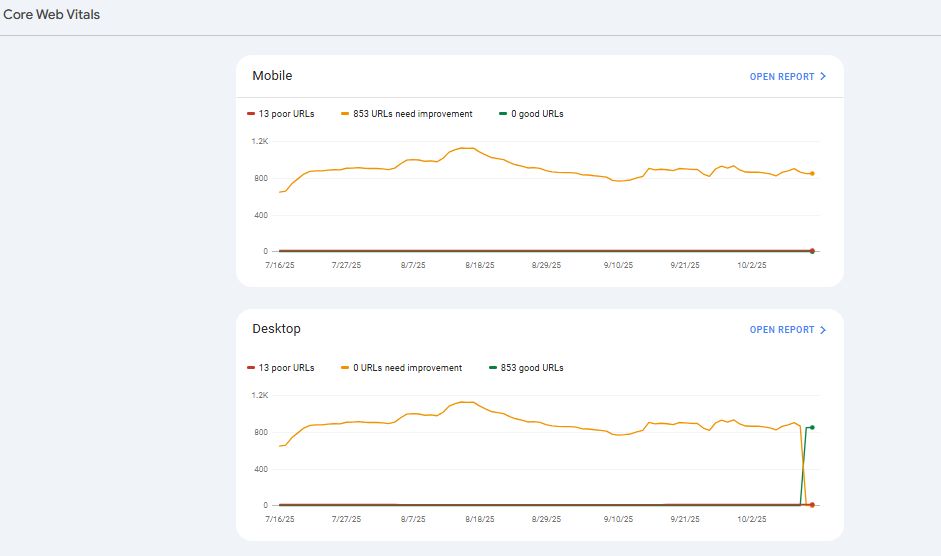
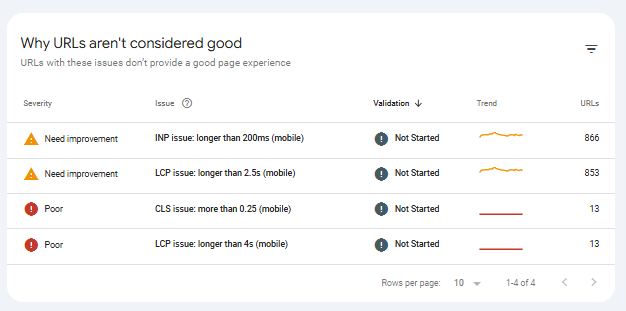
Page speed used to be a nice-to-have. Now it’s a ranking factor. The Core Web Vitals report breaks down your site’s performance into three metrics: LCP (loading), FID (interactivity), and CLS (visual stability). Sounds technical?
Here’s all you need to know: If you see red or orange bars, those pages are losing rankings. Period. Fix the pages with the most traffic first – usually your homepage and top landing pages.
Mobile Usability Report
With 63% of Google searches happening on mobile, this report can’t be ignored. It flags issues like text too small to read, clickable elements too close together, and content wider than screen. Each error comes with a list of affected pages.
Pro tip: Don’t just fix individual pages. Look for patterns. If 50 pages have the same mobile issue, it’s probably a template problem.
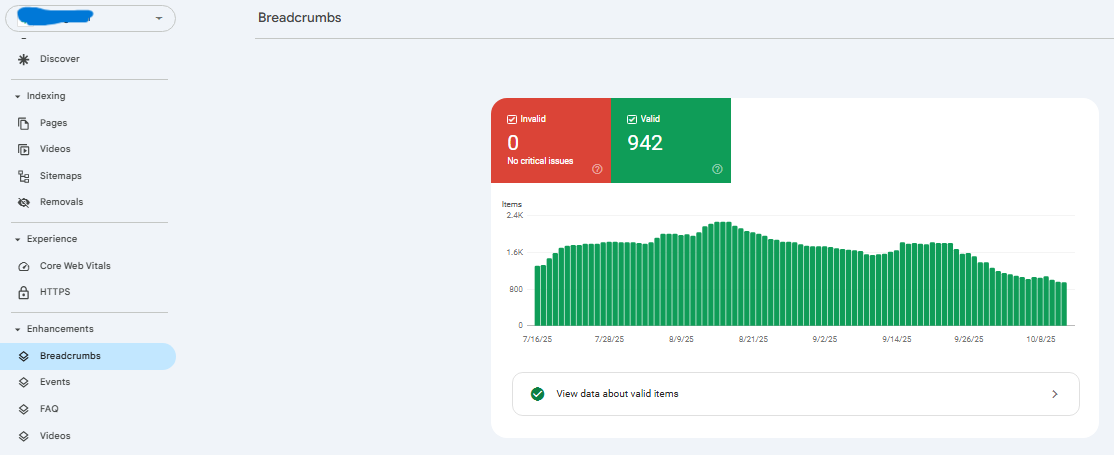
Enhancements Report
This section changes based on your site type. E-commerce sites see Product results, recipe sites get Recipe cards, job boards show Job postings. Each enhancement type has its own report showing structured data errors.
Why care about structured data? Rich snippets can double your CTR. That’s free traffic without improving rankings.
Step-by-Step Audit Process
Let’s be honest – the official Google documentation makes this seem way more complicated than it needs to be. After running hundreds of audits, I’ve boiled it down to five steps that take about 45 minutes total.
1. Set Up and Verify Your Website
Skip the HTML file verification – it’s a pain. Use Google Tag Manager or add a DNS TXT record instead. Takes two minutes. Once verified, submit your sitemap (yoursite.com/sitemap.xml) and wait 48 hours for initial data.
Critical step most people miss: Add all four versions of your site:
-
http://yoursite.com
-
https://yoursite.com
-
http://www.yoursite.com
-
https://www.yoursite.com
Then set your preferred version. This prevents data fragmentation.
2. Check Indexing Coverage
Head to the Page Indexing report and look at the summary graph. Your valid pages should trend upward over time. A sudden drop? Something’s broken.
Click into “Why pages aren’t indexed” and sort by number of affected pages. Start with the biggest issues first. Nine times out of ten, it’s one of these:
|
Issue |
Quick Fix |
|
Soft 404 |
Add more content or properly 404 the page |
|
Blocked by robots.txt |
Check your robots.txt file for overly broad rules |
|
Redirect error |
Fix redirect chains (max 2 hops) |
3. Analyze Search Performance Metrics
Open the Performance report and set the date range to last 3 months vs previous 3 months. This shows trends, not just snapshots. Export the queries report to CSV (you’ll thank me later).
What should you actually do with this data? Three things:
-
Find pages ranking 4-10 for high-volume terms and optimize them
-
Identify queries you rank for but don’t have dedicated content about
-
Spot cannibalization (multiple pages ranking for the same term)
4. Review Technical SEO Issues
The Core Web Vitals report is your technical checklist. Click “Open Report” and filter by “Poor URLs” first. These pages are actively being demoted in search results.
Here’s the frustrating part: Google tells you a page is slow but not exactly why. You’ll need to run each problem URL through PageSpeed Insights for specifics. Focus on issues affecting multiple pages – usually it’s oversized images or render-blocking JavaScript.
5. Identify Content Optimization Opportunities
This is where you turn data into action. Export your Performance report and sort by impressions (high to low). Look for pages with over 1,000 monthly impressions but CTR under 2%. These pages are visible but not compelling.
Quick wins for low CTR:
-
Add the current year to title tags (“2024 Guide to…”)
-
Include emotional triggers (easy, proven, mistakes)
-
Use brackets or parentheses for emphasis
-
Match search intent better (how-to vs what-is)
Maximizing Your SEO Audit Results
Running the audit is just step one. The real work? Actually fixing what you find. Most site owners generate a massive list of issues and get overwhelmed and fix nothing and wonder why rankings don’t improve.
Smart approach: Pick three high-impact fixes each month. Start with indexing issues (they block everything else), then page speed, then content optimization. Track changes in a spreadsheet with dates and affected URLs. You need this for correlating improvements with ranking changes.
But what about ongoing monitoring? Set up email alerts for coverage issues and manual actions. Check Performance weekly, other reports monthly. Takes 15 minutes if you know what you’re looking for.
FAQs
How often should I perform a Google Search Console SEO audit?
Monthly for active sites, quarterly for stable sites. But check Performance weekly – catching drops early makes fixes easier. Set calendar reminders or you’ll forget (we all do).
What are the most critical errors to fix first in Search Console?
Indexing blocks trump everything. Then server errors (5xx), then mobile usability, then Core Web Vitals. Speed issues can wait if pages are at least getting indexed.
Can Google Search Console replace paid SEO audit tools?
For technical SEO and content optimization? Absolutely. For competitor analysis and backlink audits? No way. Use Search Console for what it does best – showing how Google sees your site.
How long does data take to appear in Search Console reports?
Performance data has a 48-hour delay. Indexing updates take 3-7 days. Core Web Vitals use 28-day rolling averages. Patience is mandatory here.
What is the difference between clicks and impressions in Search Console?
Impressions = your site appeared in search results. Clicks = someone actually visited. The ratio between them (CTR) tells you if your titles and descriptions are working.

Ridam Khare is an SEO strategist with 7+ years of experience specializing in AI-driven content creation. He helps businesses scale high-quality blogs that rank, engage, and convert.

